Cost of Constructing Homes in Washington
Understanding the Cost Drivers that Hinder Private Industry from Delivering Affordable Housing Units
Executive Summary
Washington state is experiencing an extreme housing supply shortage which is illustrated by findings of a new book entitled Homelessness is a Housing Problem. The authors attribute the increase of homelessness as a failure of our housing market structure rather than an array of various personal factors (such as mental illness or drug use).
With previous reports published by BIAW referencing the extreme costs that zoning regulations have on the final sales price of new homes, we have been requested to do a similar study that excludes land costs. For policymakers aiming to make real progress on housing affordability, understanding all the costs that go into constructing a new home is crucial for minimizing unintended consequences of the policy options that exist.
Based on a national survey of home builders, we compiled the Top 10 Cost Drivers in Home Construction with national averages provided for each line-item cost. We’ve included an estimate of this cost for Washington, utilizing the state’s average geographic cost modifier of 1.04 reported by BNI’s Home Builder’s Costbook.
This table can be particularly useful in identifying how cost adjustments in just one category can price families out of the opportunity to own a home. For example, each line-item that has an asterisk next to it is influenced by the building codes. For example, the category titled Major System Rough-Ins is influenced by the energy code. After July 1, 2023, this category will increase by a minimum of $5,000 just considering the heat pump water and space heating mandates.
Top 10 Cost Drivers in Home Construction
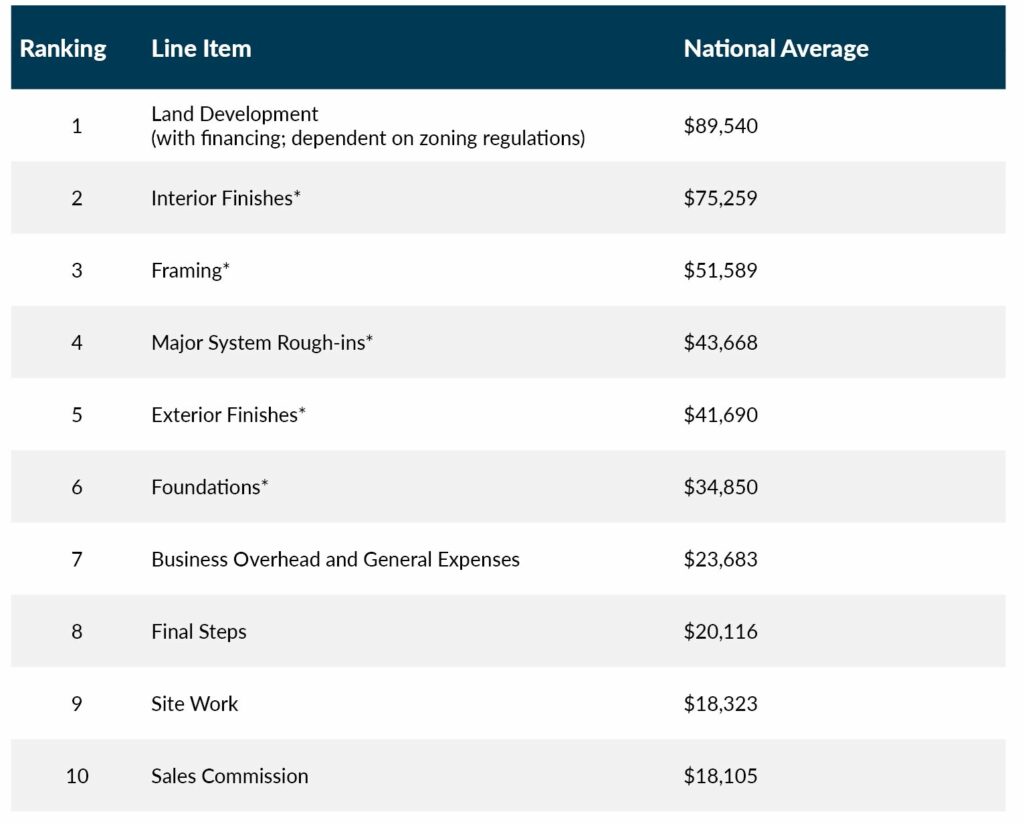
*Building codes increase costs in these areas as they become more stringent and require more expensive materials and appliances.
Methodology
To begin our research, we needed to determine construction costs for each major stage of construction. We utilized the construction cost survey results published in the National Association of Home Builders’ (NAHB) special study, “Cost of Constructing a Home” from January 2, 2020. It’s important to recognize that each category includes all the costs paid by a builder that go into that category, including labor costs, cost of materials, and overhead of operating a business.
Respondents were asked to provide information related to the typical single-family home built by their companies in 2019. While the data is relatively dated, self-reported percentages for each category align closely with the 25-year averages for each category. After compiling a table with average construction costs expressed as percentages, we then applied these percentages to the median new home sales price to estimate costs (in dollars) for each phase of construction.
Finally, the Top 10 Cost Drivers in Construction was created using the national averages reported in NAHB’s special study. This ranking can be useful when analyzing which areas of construction are responsible for overall home price increases. We plan to explore this topic more in-depth in future publications.
Limitations
The information published throughout this report is for illustrative purposes only. Because we don’t have state level data available to us at the time of this report, it’s important to be transparent about the limitations of this study:
- The Construction Cost Survey had a representative sample of 6,516 home builders nationwide. The sample was stratified by the size of the builder and the region in which they were located. Still, it is entirely possible that the sample did not include a home builder from Washington.
- Data from the survey is from 2019, and as such we can expect that these costs have increased since the economic fallout of the pandemic.
- As stated previously, we did not include the full cost of land (except in cases where builders improve the lot via landscaping and sitework) because it’s variable across the state, dependent upon zoning regulations, market demand, and the variable cost for builders to make a plot of land buildable.
- This study is only relevant to single-family detached homes. While we’re confident that these percentages could be easily translated and usable for attached townhomes, we do not advise that condos or other multi-family structures utilize our methodology because the underlying assumptions would not hold true.
Results
The median new home sales price is $635,131 and the average new home built is 2,450 square feet. This translates into a rate of $259 per square foot.
Table 1. Sales Price Breakdown for WA
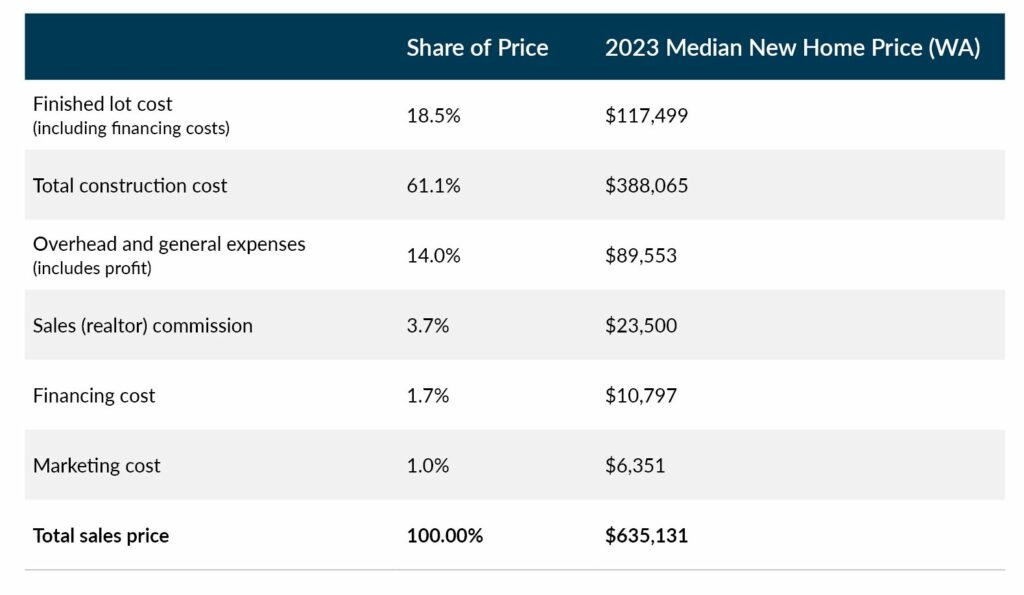
Table 2. Total Construction Cost Breakdown
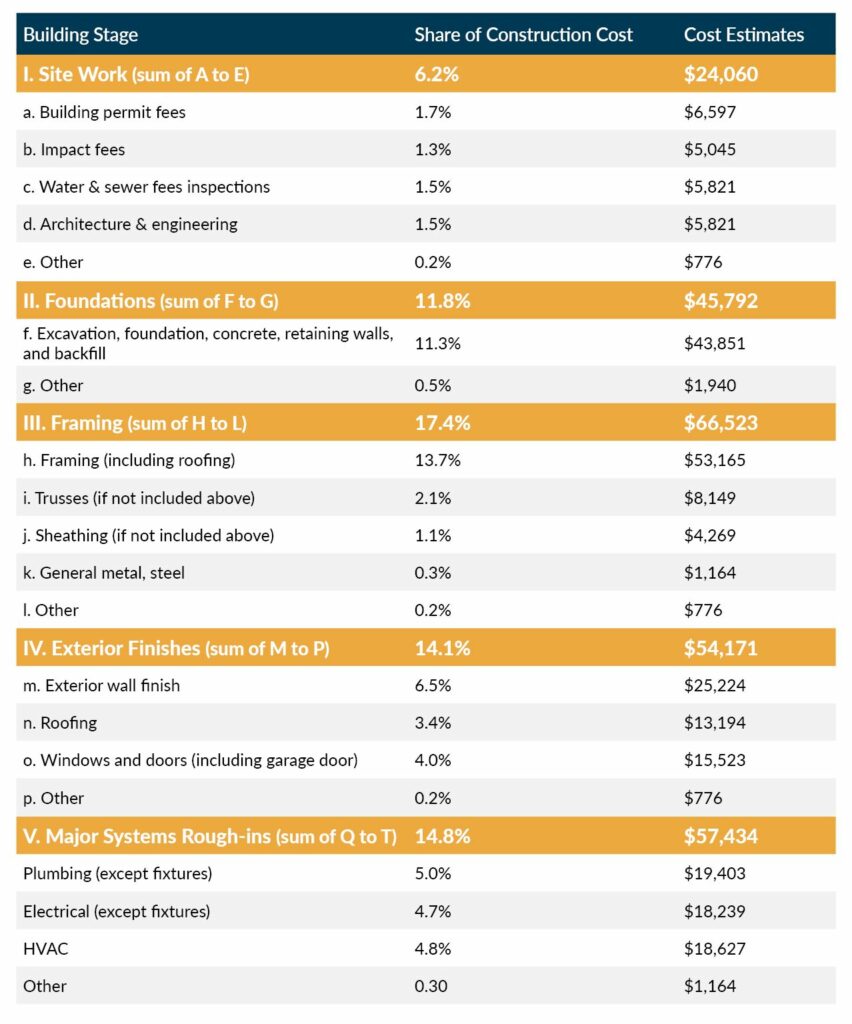
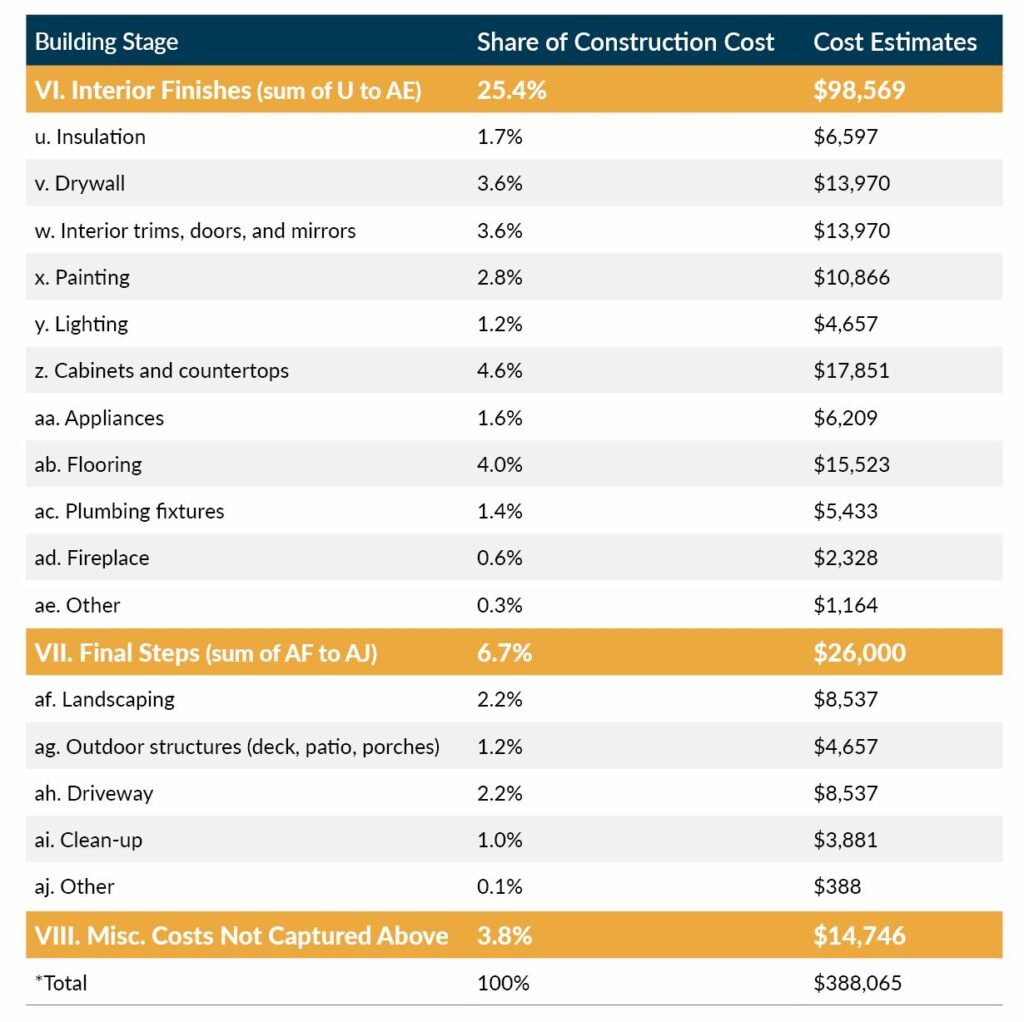
*Percentages may not add up to 100%, as they are rounded to the nearest percent.
Policy Considerations
Regulations Increase Cost of New Homes
Regulations are important and worthwhile in many cases. However, some are arbitrary and burdensome. We used the example of building codes adding costs in various stages of the construction but other regulations exist. One example is local parking regulations that mandate one, two, or more parking spaces dependent on what type of structure is built and its future uses. Some jurisdictions reduce the number of parking spaces required for single-family homes if a garage is constructed, whereas others do not count garage parking spaces in their definition of a parking space. If an extra one or two parking spaces (in addition to garage parking spaces) are required for a single-family home, that can add substantial cost.
Buildable Land in Short Supply
Zoning regulations are only half the problem. Land availability is a large barrier to the ability of the private sector to build more housing units. Under the Growth Management Act, municipalities are required to complete a comprehensive plan every ten years. A crucial element within this plan is the buildable lands inventory that determines how much land is available for each land-use designation. How municipalities count existing inventory, and how they forecast population growth are just two factors that can influence how much land is set aside for housing units, commercial purposes, and other uses.
A Workforce in Crisis
The “College for All” message over the last 20 years has resulted in a Silver Tsunami – the term coined to describe the greying of the industry’s workforce and future retirements – has already begun, and as it continues, labor costs will continue to increase. The construction industry offers higher wages than service industries and job growth in recent history has remained stable. Additionally, the construction industry offers more opportunities for entrepreneurs to own and operate a small business.
References
2023. Zhao, N. “NAHB Priced-Out Estimates for 2023.” Retrieved from https://www.nahb.org/-/media/NAHB/news-and-economics/docs/housing-economics-plus/special-studies/2023/special-study-nahb-priced-out-estimates-for-2023-march-2023.pdf
2022. Colburn, G. and Aldern, C. Homelessness is a Housing Problem: How Structural Factors Explain U.S. Patterns. University of California Press. https://homelessnesshousingproblem.com/
2020. National Association of Home Builders. “Cost of Constructing a Home.” Retrieved from https://www.nahb.org/-/media/8F04D7F6EAA34DBF8867D7C3385D2977.ashx
2022. U.S. Census Bureau. “Quarterly Sales 2022.” Retrieved from https://www.census.gov/construction/nrs/pdf/quarterly_sales.pdf
2021. U.S. Census Bureau. “Current Data, Annual Characteristics of New Housing.” Retrieved from https://www.census.gov/construction/chars/current.html
2022. BNI Building News. Home Builders Cost Book, 30th Edition.
Date of First Publication: May 1, 2023
Prepared by Andrea Smith, MPA
Copyright Building Industry Association of Washington 2023. All Rights Reserved.
No part of this material or any research report may be copied, photocopied, or duplicated in any form by any means or redistributed without the prior written consent from the author and/or funding authority.
Disclaimer
The content in this report is intended for informational purposes only. The information contained in this report may not constitute the most up-to-date economic, housing, or other information, nor does it represent a complete assessment of the housing market. This report does not constitute any recommendation or solicitation to any person to enter into any transaction, or to adopt any investment strategy. Any business or investment decisions should not be based purely on the information presented in this report. Readers are encouraged to seek independent professional investment, legal, and/or tax advice. All liability with respect to actions taken or not taken based on the contents of this report are hereby expressly disclaimed. The content is provided “as is;” no representations are made that the content is error-free.